
Playa del Carmen weather and the regional climate
Playa del Carmen weather varies from day to day, so historical averages are a starting point rather than a forecast. The monthly figures below come from CONAGUA and SMN station 23155 in Cancún, a regional comparison station in the municipality of Benito Juárez. They are not measurements made in Playa del Carmen. Use them to compare months, then check the actual forecast close to your plans.
The normal period is 1991 to 2020; the source file was issued on October 30, 2026. Each temperature column represents an average daily high or low, not a record or a promise for a particular day. Rainfall is the average total for the month, not the number of rainy days. For an individual excursion, look at the current forecast as well.
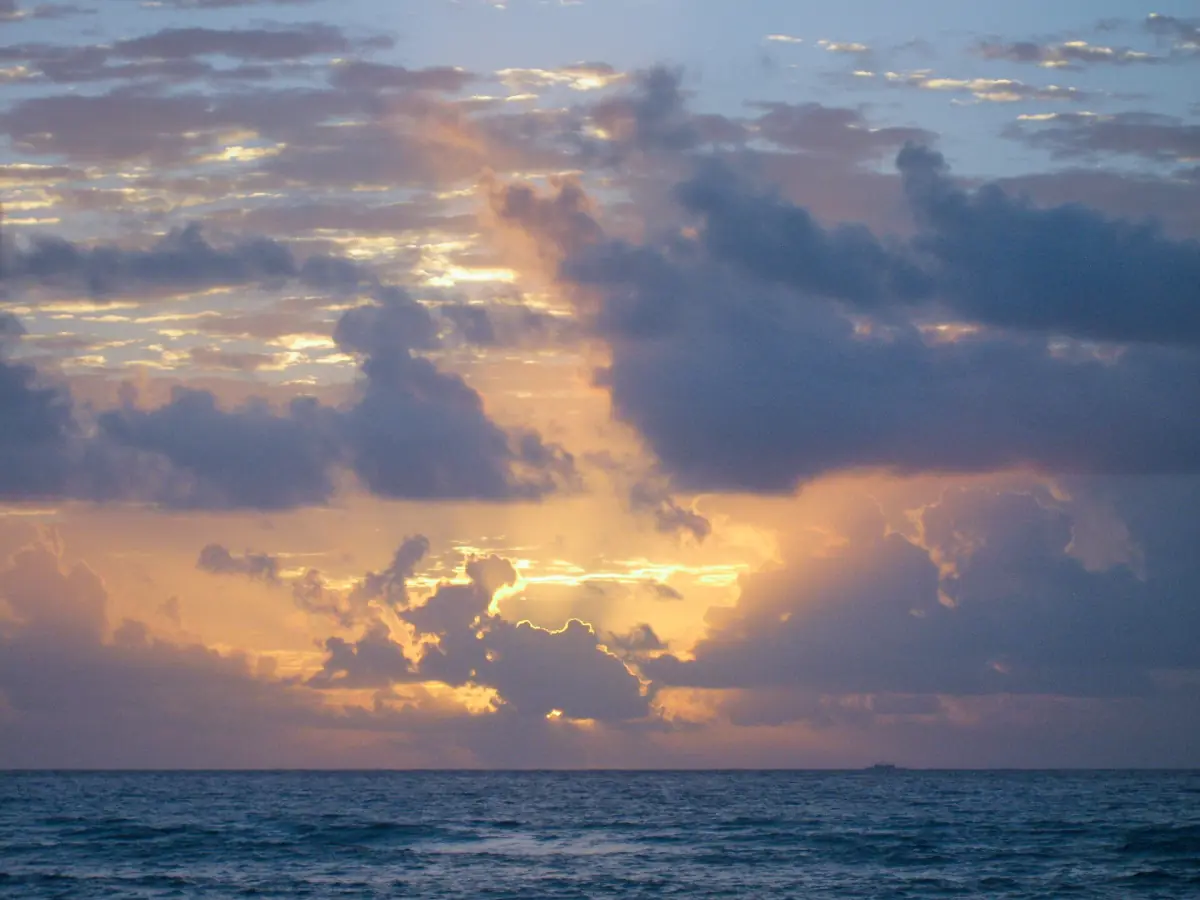
Monthly temperatures and rainfall
The table uses degrees Celsius and millimetres. At this Cancún station March has the lowest average monthly rainfall and October the highest. That ranking describes this particular series, not every location along the coast. Individual trips can experience quite different conditions from the historical average.
| Month | Average high °C | Average low °C | Rain mm |
|---|---|---|---|
| January | 28.7 | 20.0 | 103.8 |
| February | 30.1 | 20.6 | 59.3 |
| March | 31.5 | 21.4 | 38.7 |
| April | 33.1 | 22.9 | 42.3 |
| May | 34.2 | 24.2 | 87.0 |
| June | 34.0 | 24.9 | 184.4 |
| July | 34.8 | 25.0 | 67.0 |
| August | 35.1 | 25.0 | 102.2 |
| September | 34.2 | 24.6 | 181.5 |
| October | 32.2 | 23.7 | 277.1 |
| November | 30.3 | 22.3 | 131.4 |
| December | 29.4 | 21.0 | 96.6 |
Read the high and low together when deciding how a day outdoors might feel. The low is an average of daily lows, not the lowest temperature ever observed. Likewise, the rainfall figure covers a month as a whole. It does not specify when a shower begins, how long it lasts or whether the next day will be dry.
A cooking class in Playa
A cooking class offers a food-focused activity in Playa del Carmen.
Hand-picked tours, booked through GetYourGuide. Prices are indicative starting prices in US dollars (as of October 2026). Tap a tour for live availability and the current price in your currency.
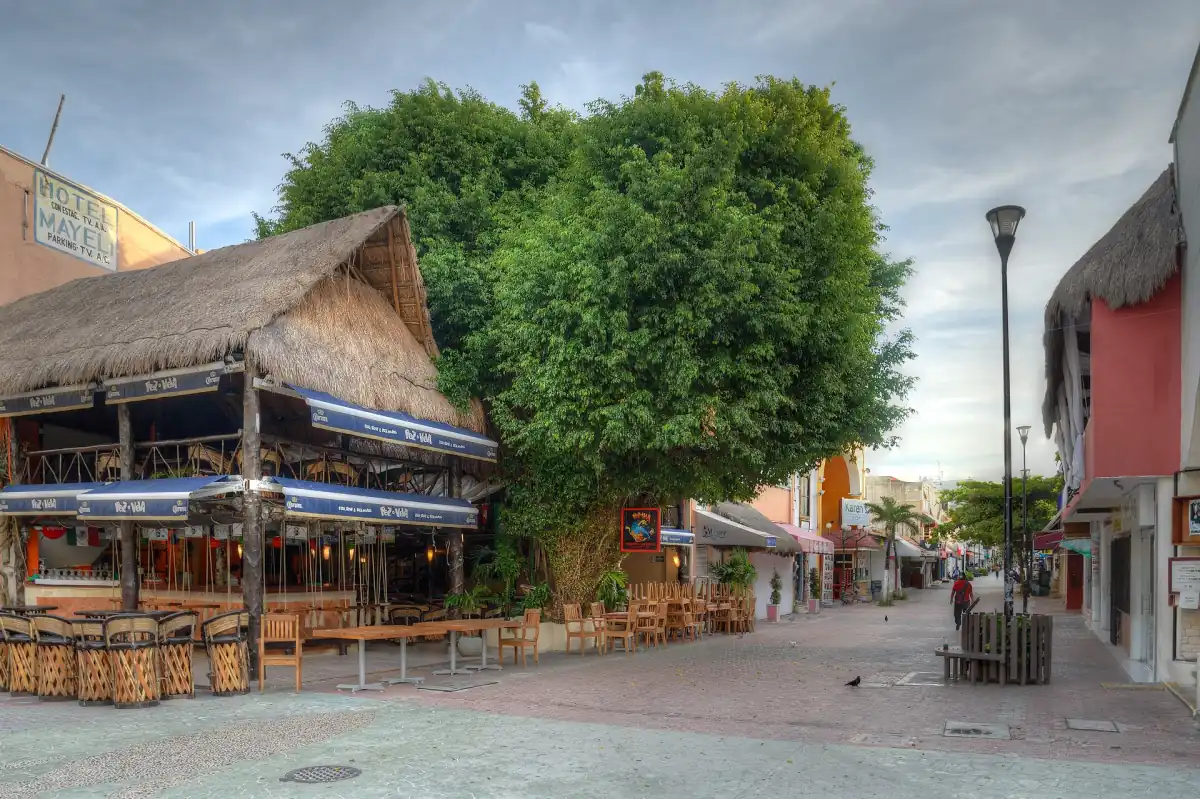
A cooking class in Playa del Carmen
A cooking class offers a different activity to consider alongside time at the water; check its arrangements for your chosen date.
Weather, sea and flexible plans
Hurricane season runs from June through November. The German Federal Foreign Office advises that tropical storms and heavy rain can cause short-notice restrictions. Before a journey during this period, follow current local instructions and leave room to adjust transport and activities. For an individual storm or crossing, consult current notices.
Seaweed conditions are a separate question from rain and temperature. The municipality reported an unusual arrival of sargassum in January 2026, and says that arrivals vary by beach and day. For a beach day, consult current conditions and distinguish the sargassum indicator from the swimming flag. The beach guide explains the distinction.
If your plans include a boat, allow time for changes and look at the current departure information. The Cozumel ferry guide covers the passenger crossing. For freshwater alternatives, the cenotes guide explains access and protection rules. A cooking class is another activity to consider, but its listing and current arrangements should guide your choice.
Use the best time to visit guide to weigh the seasonal averages against the kind of day you want. If you are already travelling, current forecasts and local notices matter more than the historical monthly figures. Pack and schedule with both sun and rain in mind rather than treating an average as a daily timetable.
Weather questions
Are these measurements from Playa del Carmen?
No. They are historical normals from Cancún station 23155, used as a regional comparison.
Which month has the most rain in the table?
October has the highest average monthly total in this Cancún series. The figure is not a forecast for a particular stay.
Does a lower rainfall average guarantee dry days?
No. A monthly average does not describe the weather on an individual day. Check the forecast for your actual dates.
Is winter guaranteed to be free of sargassum?
No. An unusual arrival was reported by the municipality in January 2026, and conditions vary by beach and day.